What is a KPI: meaning, the 4 types, KPI trees, setting up KPIs & 350 examples

Photo Daan van Beek
Author: Daan van Beek
Senior KPI Consultant and Author
Table of Contents

A Key Performance Indicator (KPI) shows how your organization, process or team is performing. It exposes the real pain points in your organization. But how do you know if you have the right KPIs? How many KPIs do you need to be decisive? And what types of KPIs actually exist? Below we discuss the entire process of creating KPIs. We explain how to systematically track, define and apply KPIs. We also show you how the right set of KPIs can help you improve your performance. Get inspired by the 350 practical KPI examples from our unique database or enlist the help of our KPI experts. This way you will avoid every treacherous KPI trap.

What is a KPI?

A KPI is an indicator that provides a razor-sharp representation of a situation or condition over time. With a KPI, you measure performance. Compare a KPI to an x-ray of your teeth. Just like the dentist, a KPI points out the real pain points in your organization. The dentist fills cavities where necessary (reactive) but also points out the importance of regular and correct brushing, and good nutrition (proactive and preventive).

Definition of a KPI: an indicator that provides a razor-sharp representation of a situation or condition over time

A KPI is a prime indicator that should be at the top of everyone’s dashboard. But there are more types of indicators. Consider the Key Result Indicator (KRI), the Performance Indicator (PI) and the normal Indicator (IND). An explanation of these can be found here. The KPI differs from other types of indicators like night and day. In fact, the KPI is the key to better results for your organization. Of course, all indicators together help you streamline activities, processes and decisions. But the trick is to keep cause (KPI) and effect (PI, KRI) sharply apart. For convenience, we call everything a KPI, but know that there are substantial differences.

The similarities of all types of KPIs

Despite the different types of KPIs, there are also similarities:

  • You define them with a formula such as gross margin = sales price – purchase price
  • They give an indication of whether something is going well or badly over time or against a standard
  • They are the starting point for further research and data analysis
  • They show you exactly what you need to improve
  • They show any (hidden) risks in your organization or processes
  • They allow you to calculate so that you can measure at all levels with the same definition
  • They show the return on activities, investments and efforts

Also check out the 7 key features of KPIs here.

How do you visualize a KPI?

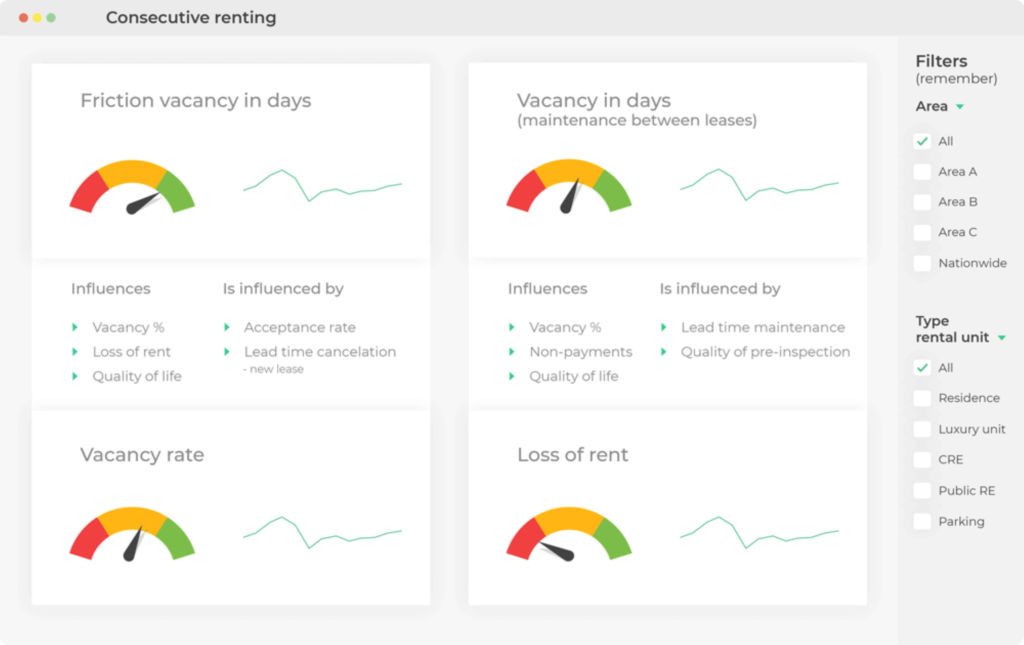
You usually visualize a KPI as a gauge or graph on a dashboard or report. This allows you to monitor and analyze the goals of your organization, process or team at a glance. And adjust where necessary.

KPI DashboardFigure 1: Example of a dashboard from the housing sector.

A KPI dashboard shows what milestones you need to achieve to reach your ultimate goals. For example, you want to save energy. In the Netherlands, you can then see in an app how many units of gas and electricity you consume and what that costs per month, per week and even per hour,.

If your goal is to save, say, 25% energy compared to the previous period, you can try to start saving extra energy if that goal is in jeopardy. Note: formulate your goals SMART.

KPI Dashboards

What is the purpose of a KPI?

Creating KPIs is never an end in itself, of course. Before you know it, you have a battery of KPIs. Again, less is more… KPIs must touch the essence of your organization. Every professional organization strives for satisfied employees, happy customers and profitability, preferably in that order. Specifically, Key Performance Indicators are primarily intended to:

  • Gain insight into the (financial) performance of the organization, a process or team
  • Motivate employees and managers to improve the score on a KPI
  • Steer so that the KPI gets the desired value
  • Keep performance accountable to other parties
  • Further professionalize the organization and processes
  • Increase the well-being of employees and increase customer value

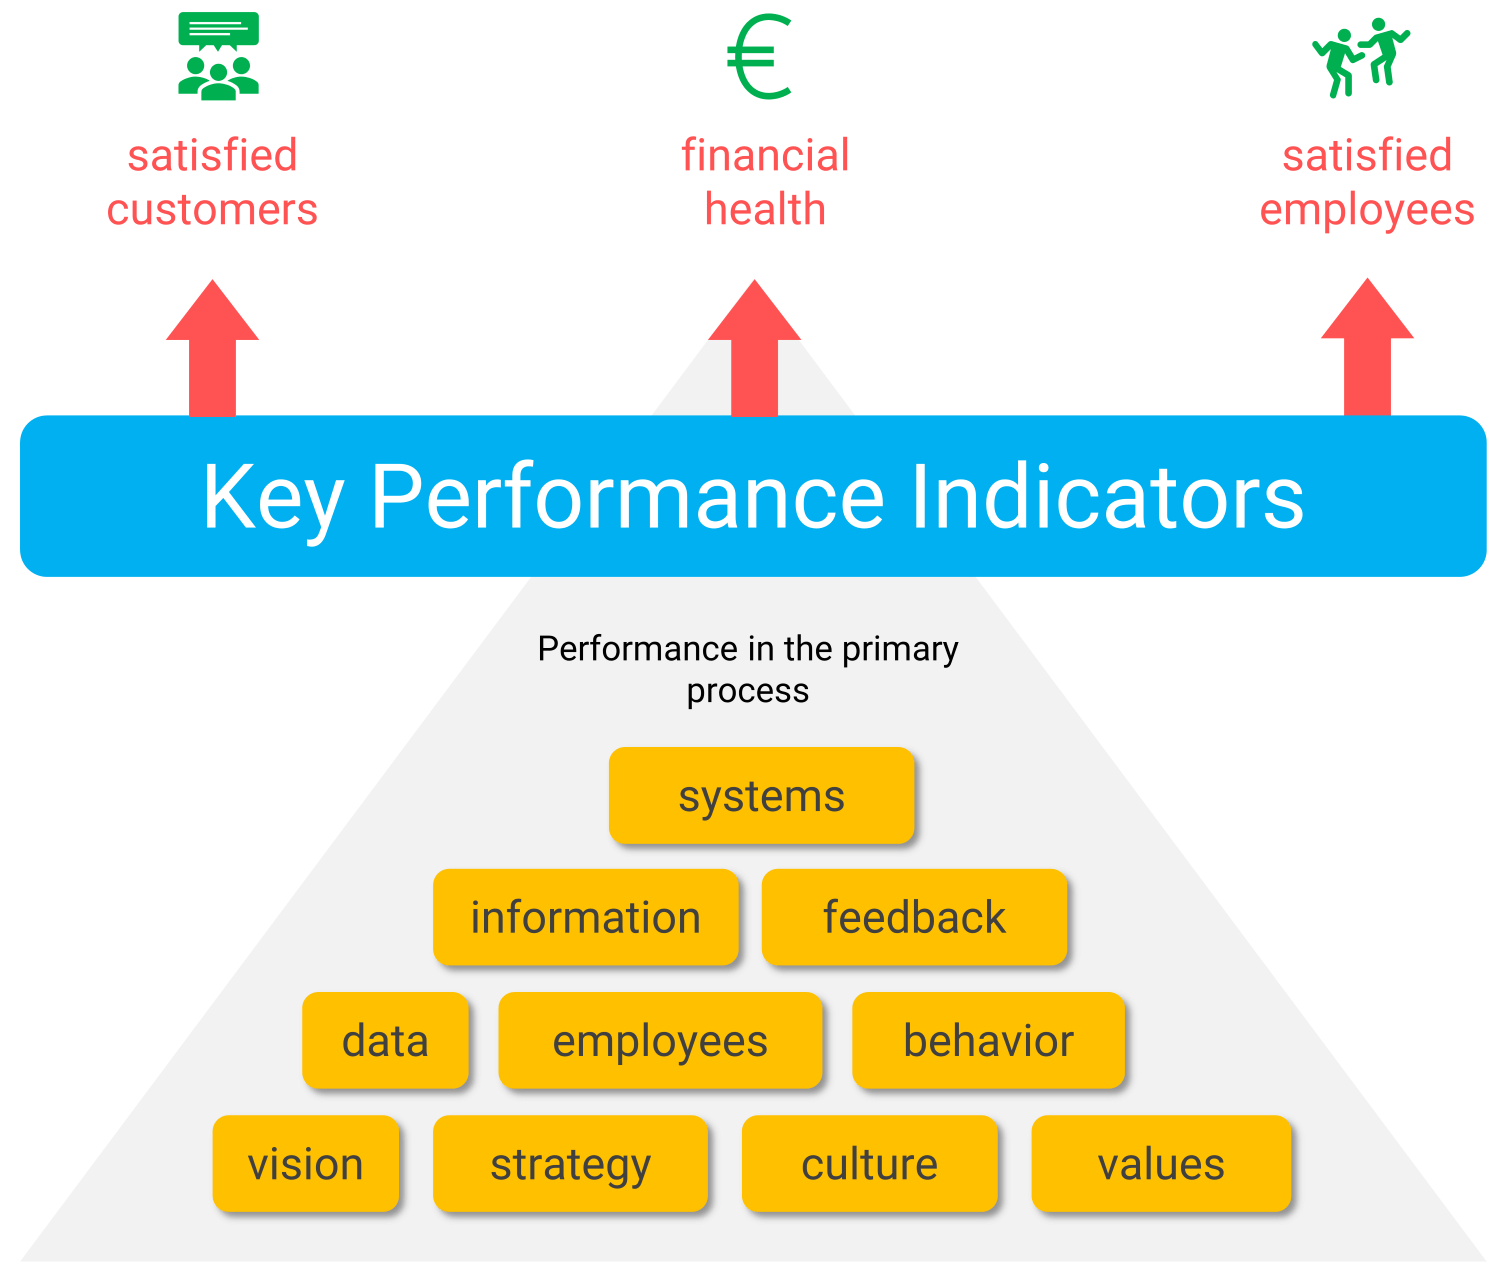
All in all, there are plenty of arguments in favor of getting started with KPIs. Satisfied employees spoil the customer who consequently spends more. Conversely, dissatisfied or disinterested employees chase away customers, resulting in lost sales. Either way, customer satisfaction, employee satisfaction and profitability are the most important three result areas of any organization (see Figure 2).

Illustration of the factors that influence KPIsFigure 2: You learn to understand the true KPI meaning when you know that all kinds of factors can influence the score on KPIs. A true KPI always directly affects financial health (profitability) as well as your employees and customers.

Now, the hallmark of a well-defined KPI is that when you steer by it, it always has a direct impact on all three result areas. If an airport tries to reduce the queues at the security check (an important logistics KPI), it directly and positively affects the three result areas mentioned above.

Travelers and employees are more relaxed, and despite higher payroll costs, costly damage claims are avoided and airlines do not divert to foreign airports. So you intervene before it’s too late. And on balance, that’s good for finances. The same goes for train punctuality.

Use the 350 KPI examples from our database

A KPI does not just appear out of thin air. Like a true Sherlock Holmes you will have to examine your business processes and administration in search of the (performance) indicators that really make the difference. Luckily, Passionned Group has already done the detective work for you.

Based on more than twenty years of practical experience, we have created an extensive database containing more than 350 practical examples from various sectors. We are giving away the first 25 KPI examples here for free. All other KPI’s can be viewed when you order the SMART KPI toolkit 2024.

  1. Airline delay: the number of flights that arrived on time as scheduled relative to the total number of flights. Average delay per aircraft expressed in number of minutes.
  2. Bed occupancy in a hospital: the number of beds unoccupied relative to the total number of beds available per day.
  3. Occupancy rate of a hotel: the number of rooms occupied relative to the total number of rooms available.
  4. Employment rate by municipality: the number of citizens who are employed relative to the total number of citizens who want or need to work.
  5. Downtime at a bank: the percentage of time a banking app or website is off the air, such as due to a DDOS or ransom attack.
  6. Hit ratio at an employment agency: the number of placements compared to the number of candidates proposed.
  7. Construction overrun: the delayed completion of construction projects, to be measured as the excess of the contractually agreed construction time, expressed in days.
  8. Vacancy at a housing association: the average number of days a property is vacant or the percentage of homes that are vacant compared to the total stock.
  9. Returns at a webshop or store: the percentage of returns relative to the number of items sold.
  10. No-show at a mental health institution: the percentage of client appointments that could not take place because clients did not show up.
  11. Euro sales: the amount of sales in euros of all products and services provided by an organization in a given period.
  12. Contracted revenue: the revenue contracted with customers for a given period, also called contract value.
  13. Ordered revenue: the revenue actually purchased by customers, whether under contract or not.
  14. Delivered revenue: the revenue delivered to customers, whether under contract or not.
  15. Invoiced revenue: the revenue that has been invoiced to your customers.
  16. Paid revenue: the revenue invoiced to and paid by customers.
  17. Percentage of undelivered sales: sales ordered but not yet delivered.
  18. Percentage of revenue not paid: the revenue invoiced but not yet paid by customers.
  19. Sales forecast: the expected sales for a certain period in the future, based on past sales, seasonal influences and weather conditions.
  20. Number of new contracts: the number of new contracts you sign with customers for the guaranteed delivery of sales.
  21. Number of current contracts: the number of contracts currently active.
  22. Number of cancelled contracts: the number of contracts cancelled in a given period.
  23. Number of renewed contracts: the number of contracts that are renewed (under the same conditions or on different terms).
  24. Number of orders: the number of orders (orders) that customers place with an organization in a given period.
  25. Number of pieces per order: the total number of pieces (products, hours) on an order.
  26. Number of products per order: the average number of products per order.
  27. Cross-selling: the percentage of customers who purchase not one but multiple products or services at one time.
  28. Up-selling: the percentage of customers who purchase a more expensive product, service or subscription.
  29. Discount on an order: the total amount of discount given on an order.
  30. Gross margin per order: the difference between total sales and the purchase value of all items on an order.
  31. Gross margin per product: the difference between the sales value and the purchase value of a product on an order.
  32. Number of quotation requests: the number of quotations requested by (potential) customers through a channel (website, chat, telephone, e-mail, and so on).
  33. Number of initial sales conversations: the number of conversations (online, on site) held as a result of a quotation request.
  34. Number of quotes: the number of quotes issued in response to a request for quote.
  35. Number of quotes signed: the number of quotes signed by the customer, called wins.
  36. Percent win: the number of signed quotes / total number of quotes issued.
  37. Sales forecasts: the number of accurate forecasts that fall within a certain range, to be measured per individual salesperson relative to the total number of sales forecasts.
  38. Average receipt amount: the total sales in a store in a given period divided by the total number of customers in that same period. This gives an indication of the extent to which your customers are willing to make impulse purchases and/or are open to cross and deep selling.
  39. Sales per square meter: the total sales in a store in a given period divided by the number of square meters of sales area available.
  40. Market share: the total sales of the organization divided by the total sales in the market multiplied by 100.
  41. Market share by product group: same as market share but filtered by one specific product group.
  42. Growth of market share: the growth or decline in percentage of market share over the past periods.
  43. Brand awareness: the number of people who spontaneously mention or recognize your brand, organization or product, as a percentage of the total consumers surveyed.
  44. Customer Effort Score: an indicator of how much effort a customer had to put into using your product or service, finding the information they needed, or getting a problem solved at your organization.
  45. Net Promoter Score (NPS): the number of promoters minus the number of critics of your brand, organization or product, both expressed as percentages of the total number of respondents.
  46. Customer Value: the value of the customer, calculated by multiplying the average purchase value of a customer by the average purchase frequency.
  47. Customer retention: the average number of years a customer continues to buy from you, or the number of years a customer remains an average subscriber and purchases services from your company.
  48. Lifetime value: the lifetime value of a customer, or the total revenue you can expect as long as someone remains a customer with you, to be calculated by multiplying the customer value by the average lifetime value of your customers.
  49. Churn ratio: the percentage of customers who cancel their contract or subscription in a given period.
  50. Number of newsletters sent: the number of newsletters you have created and sent to a certain target group, or to all your customers.
  51. Number of subscribers to your newsletter: the number of people who give your organization permission to send an (electronic) newsletter.
  52. Number of unsubscribes to your newsletter: the number of people who indicate that they no longer wish to receive your (electronic) newsletter.
  53. Number of ads published: the number of times your organization advertises in a trade magazine, newspaper or website to communicate or convey a message to a specific target group in order to increase brand awareness.
  54. Number of campaigns: the number of campaigns you have launched to communicate a specific message. A campaign can consist of multiple ads, multiple ad moments, different mass emails or messages through other channels.
  55. Number of unique visitors: the number of different users who have visited your website in a given period. One person can visit your website multiple times.
  56. Number of page views: the total number of web page views, where repeated views of one page also count.
  57. Number of impressions: indicates how many times a user has seen a link to your site in search results. This is calculated in different ways for images and other types of search results, depending on whether the result was scrolled into view.
  58. Number of sessions: the number of user interactions that occur on your Web site within a given period of time. One session can include multiple screen or page views, events, social interactions and transactions.
  59. Average session duration: the average amount of time in minutes visitors spent viewing a specified page or screen or series of pages or screens.
  60. The value of a page on your website: the percentage of revenue realized from conversions in a given period where a visitor passes a specific page. From this you can see which pages add value in conversions and which do not.
  61. Visitor website bounce rate: the percentage of all sessions on your website in which users viewed only one page before leaving the website.
  62. Engagement rate: the inverse of the bounce rate. So the percentage of sessions where a visitor does not abandon, but interacts with the content. The visitor shows engagement by sharing or liking a social media post and/or content.
  63. Click Through Ratio (CTR): the percentage of impressions in search results that led to a click on a link to your website.
  64. Exit Rate: the percentage of website abandonment that occurred through a particular web page or series of web pages.
  65. Conversion rate: the percentage of sessions on your website that led to a transaction such as purchasing a product or downloading a white paper. You can also measure this by the number of visitors instead of sessions.
  66. Number of inbound leads: the number of potential customers including their data that enter the sales funnel through the website or other channels.
  67. Number of qualified leads: the number of leads where it has been determined that they belong to your target audience and are relatively easy to convert to customers.
  68. Percentage of useless leads: the percentage of incoming leads that contain “fake” information, such as a fake email address or name.
  69. Lead response time: the average number of hours or days that elapse before the salesperson contacts a potential customer. Here, the sooner the better. If sellers follow up on their leads within one hour, the scoring rate increases by a factor of seven.
  70. Average position (ranking): the average position of your site in search results given a particular keyword.
  71. Average page depth: the average number of web pages a visitor views during a visit to your website.
  72. Organic traffic: the percentage of traffic that comes from search engines without paid advertising.
  73. Number of social media posts: the number of times your organization posts on social media.
  74. Reach: the number of people who see a social media post or content come along in their timeline.
  75. Earnings per click (EPC): total fees or commissions earned by your affiliate partner divided by the number of clicks your affiliate partner sent through their tracking links.
  76. Cost per click (CPC): total cost for an ad campaign divided by the number of clicks you received.
  77. Maximum cost per click: the highest amount you are willing to pay for a click on your ad during an online ad campaign.
  78. Bounce ratio emails: the percentage of mass emails that are not delivered but come back with an error message.
  79. Open ratio emails: the number of times someone opens a mass email you sent, divided by the total number of successfully delivered emails.
  80. Click to open ratio emails: the number of times someone clicked on a link in the mass email, divided by the total number of emails opened. Thus, the ratio can exceed 1 if one person clicks the link repeatedly.
  81. Unsubscribe rate emails: the percentage of recipients who unsubscribe from your mailing list after receiving a mass email.
  82. Number of machines: the number of machines an organization owns for production.
  83. Utilization rate: the degree to which the available production capacity of all machines is actually used expressed as a percentage.
  84. Utilization rate per machine: the number of minutes a given machine is running production relative to the total number of minutes a machine can run production.
  85. Conversion time: the average time in minutes required to convert the machine to produce other products or new batches of the same product.
  86. Downtime% machines: the inverse of utilization rate per machine measured per unit of time and broken down by cause: preventive maintenance, unscheduled maintenance, power outages, changeover time, personnel downtime, and so on.
  87. Scheduled maintenance: the time a machine is idle due to preventive maintenance.
  88. Throughput: the number of units produced by a machine per minute, hour, day or week.
  89. Cycle time (CT): the average lead time from the beginning to the end of a production process or subprocess to arrive at a finished or semi-finished product.
  90. Cash-to-cash cycle time: the time that elapses between when money is spent for raw materials, inventory or a factory and when the company actually receives money from its customers for the products delivered.
  91. Takt time: the time in minutes or seconds it takes to produce a product given the customer demand. If the customer requests 300 products per day and the production time per product is two hours then you need 24 seconds per product (7,200 seconds divided by 300).
  92. Lead Time (LT): the total process time of the production line, or in other words the process times of successive steps added together plus all waiting times of products in the process.
  93. Lead time reduction: the reduction in time between the time of order and the time of delivery.
  94. Process time: the time a semi-finished product or product spends on a workstation or production platform.
  95. Number of hours worked: the number of hours worked by a process operator.
  96. Number of absentee hours: the number of hours a process operator has not been productive, expressed as a percentage of the hours as agreed in the labor contract.
  97. Overtime percentage: the number of overtime hours worked by employees relative to the number of standard hours. It is an indicator for detecting inefficiencies in scheduling and/or staffing.
  98. Number of product defects: the average number of (serious) defects found per product, measured per batch or time unit.
  99. Number of orders produced: the number of orders produced per unit of time.
  100. Percentage of orders in production: the number of orders in process compared to the total number of orders.
  101. Order specification deviation: the percentage of orders that do not meet specifications relative to the total number of orders.
  102. Back log: the number of orders queued to be put into production relative to the total number of orders.
  103. Order turnaround time: the average time between receiving an order and shipping it.
  104. Productivity in production: number of hours worked on customer orders relative to total staff workable hours, expressed as a percentage per employee, team or department.
  105. Purchase order approval rate: the percentage of purchase orders that are approved (automatically).
  106. Customer order lead time: the average number of days between order and delivery date.
  107. Production return rate: the number of products returned relative to the total number of orders delivered, broken down by reason for return.
  108. Number of quality inspections performed: the number of spot checks performed to check quality, or expressed as a percentage relative to the total number of units produced.
  109. Dropout: the number of units of finished or semi-finished products rejected during a final inspection or quality inspection.
  110. Rework: the number of hours an employee and/or machine spends remanufacturing or correcting incorrect orders.
  111. Average weight of production waste: the average number of pounds of waste per production batch or unit of time.
  112. Stock level: the stock of a specific product or item at a specific time.
  113. Average stock: the stock at the beginning of a month or year added to the stock at the end of a month or year, divided by two.
  114. Turnover rate: the number of times inventory is turned over in a given period.
  115. Obsolete inventory: the number of units of finished goods in inventory that have become unsaleable relative to total inventory.
  116. Destroyed stock: the number of units of stock destroyed divided by the total stock (of a given semi-finished product, product or product group).
  117. Delivery reliability: the extent to which a supplier delivers products or services to its customers according to the agreed conditions (delivery date, quantity, price and quality).
  118. Number of calls handled: the number of customer requests and queries handled by the customer service department or call center, to be measured by month, week, day and hour. Possibly to be compared with the same period last year.
  119. First-time right calls: the percentage of calls that the call center handled properly, to the customer’s satisfaction, in one call compared to the total number of calls handled. The customer is satisfied and does not call back again with the same question.
  120. Handling time: the average time spent by a call center customer from initial contact with the call center to resolution of the problem. It includes the waiting time and the time of the contact itself.
  121. Completion time: the average additional time a call center agent needs to complete administrative tasks after completing a (customer) call.
  122. Average call duration: the average number of minutes a call center agent spends on the line with a customer.
  123. Cost per call: the total cost of the call center divided by the number of calls handled, possibly compared to other similar call centers.
  124. Call center productivity: the number of calls handled by a call center employee in a given time period, compared to the number of calls handled by peers in the same period.
  125. Average hold time: the average time an incoming call is on hold, or customers waiting to be called back, to be measured by dividing the total hold time by the number of customers put on hold.
  126. Response time: the average number of seconds a customer has to wait before being answered by a call center employee. The standard is 30 seconds.
  127. Missed calls: the number of calls not answered by call center employees relative to the total number of calls, expressed as a percentage.
  128. Disconnected calls: the number of calls in a call center where the customer disconnects because, for example, the menu is unclear or complicated, or because he perceives the waiting time as too long.
  129. Customer satisfaction call center: the number of customers of a call center who are willing to recommend the organization because of a correct, proper handling of their complaint or request, to be measured via the Net Promoter Score (NPS).
  130. Number of emails: the average number of emails received per week or day in all accessible mailboxes of a call center.
  131. Email handling backlog: the number of unanswered email messages in a call center relative to the total number of email messages received.
  132. Waste of time: the time a call center employee wastes by maintaining unnecessary telephone contact when he or she could be referring directly.
  133. Number of complaints: the number of complaints reaching an organization per week or month about the call center or customer service department.
  134. Complaint rate: the average number of complaints reaching the call center expressed as a percentage of the total number of calls handled by the call center.
  135. Complaint accumulation: the number of calls from customers who call the call center for the same problem relative to the total number of complaints received.
  136. Number of outstanding complaints: the number of complaints that the customer believes have not yet been satisfactorily resolved relative to the total number of complaints handled by the call center.
  137. Number of incorrect referrals: the number of referrals from the call center to other customer contact channels that are incorrect, to be measured by asking the customer if the call was handled satisfactorily.
  138. Repeat Call Rate: the number of repeat calls from the same customer received by the call center in the past five to 10 days. These are calls coming from the same phone number, which these repeat calls can therefore be identified by.
  139. Number of items purchased: the total number of items an organization purchases in a given period.
  140. Number of purchase orders: the total number of purchase orders an organization sends in a given period.
  141. Purchase price: the price an organization pays for the products or services it purchases.
  142. Purchase margin: the difference between the purchase and selling price of an item. Purchase margin can be expressed as a percentage and as an amount per purchased item.
  143. Average order size: the total amount of purchased items divided by the total number of purchase orders placed.
  144. Average purchase amount: the total amount of purchase value divided by the number of orders placed.
  145. Average processing cost: all costs incurred by a purchase invoice from entry to payment, such as payroll costs, processing costs, printing costs and so on, divided by the total number of purchase invoices processed.
  146. First-Time Match Rate: the percentage of purchase invoices that successfully match the purchase order and receipt on the first attempt (called 3 way matching) without human intervention, as a percentage of the total number of attempts to match invoices with purchase orders.
  147. Purchasing productivity per fte: the total number of purchase invoices processed divided by the number of fte employed in the Purchasing Department.
  148. Percentage of rejected purchase invoices: the average number of purchase orders that do not meet procurement requirements, to be measured as the number of rejected purchase invoices divided by the total number of purchase invoices processed.
  149. Average lead time of purchase invoices: the total processing time of purchase invoices divided by the total number of purchase invoices processed.
  150. Percentage of “touchless” invoices: the number of fully automated purchase invoices processed, to be expressed as a percentage of the number of manually processed purchase invoices.
  151. Number of suppliers: the number of regular suppliers on an annual basis from which the organization purchases goods and services, including any preferred suppliers. The average number of suppliers can vary quite a bit by industry.
  152. Supplier credit: the average number of days that the purchaser receives a deferred payment from its supplier. In other words, the goods are delivered first and paid for later.
  153. Average discount per supplier: the total amount of discounts granted divided by the number of suppliers.
  154. Purchasing efficiency: the number of suppliers calculated per 1,000 purchase invoices.
  155. Supplier dependency: average number of suppliers available for replacement.
  156. Supplier reliability: the extent to which the right product quantities are delivered at the right time.
  157. Order cycle: the average time in days between when a purchase order is placed and when the products or services are delivered.
  158. Innovation rate: the number of patents, patents, licenses applied for at the Netherlands Patent Office, the European Patent Office and/or the US Trademark And Patent Office and so on.
  159. Pipeline patents: the number of patents applied for but not yet decided on.
  160. Number of approved patents: the number of patents assigned after review by the relevant reviewing body and then stored in a publicly accessible database.
  161. Patent approval ratio: the number of patents approved divided by the total number of patents applied for.
  162. R&D spending: the percentage of sales spent annually on research and development (R&D).
  163. Price-to-research ratio (PRR): the ratio of a company’s market capitalization to its research and development (R&D) expenditures.
  164. Defect ratio: the number of defects discovered after the market launch of a new product relative to the total number of new products produced.
  165. Recalls: the number of recalls after the market introduction of a new product due to defects and/or safety issues.
  166. Innovation pipeline: the number of new products under development at any given time.
  167. Average success ratio: the number of new products successfully brought to market relative to the number of products that failed during the innovation process.
  168. Failure ratio: the number of innovative projects stopped prematurely relative to the total number of innovation projects defined and initiated.
  169. Sales contribution: the cumulative sales of the new products divided by the sales of the current existing products (the cash cows).
  170. Innovation budget: the budget approved and reserved for innovation in euros.
  171. Innovation ROI: the return on investment of an innovation, or the revenue of the innovation minus the cost of the innovation divided by the cost of the innovation. The outcome is shown as a percentage.
  172. Average innovation lead time: the total time spent on innovation divided by the number of newly introduced products, expressed in weeks, months and years.
  173. User adoption: the percentage of users who use the new product immediately after its introduction.
  174. Time-to-Prototype: the time in weeks, months or years it takes to develop a prototype.
  175. Headcount R&D: the number of employees directly involved in innovative projects and production, relative to the total number of FTEs employed by the organization.
  176. FTE: the number of permanent employees on the payroll who perform work for your organization based on full-time, part-time or zero-hours contracts.
  177. Flexible shell: the number of employees who offer and perform services for the organization based on a freelance contract, to be expressed in absolute numbers and as a percentage of the total workforce.
  178. Number of performance appraisals: the number of annual performance appraisals to be scheduled and conducted.
  179. Overdue performance appraisals: the number of performance appraisals yet to be conducted relative to the total number of scheduled performance appraisals, to be expressed as a percentage.
  180. Employee retention rate: the total number of employees still working for the organization both at the beginning of a period and at the end of the same period multiplied by one hundred. This is also known as talent retention.
  181. Promotion ratio (vertical mobility): the proportion of employees promoted over the past calendar year, to be calculated by dividing the number of promotions by the average number of employees multiplied by 100.
  182. Number of dismissal procedures: the number of employment contracts terminated not through natural attrition but through a dismissal procedure, to be measured in absolute numbers and as a percentage of the total number of employment contracts.
  183. Number of dismissal procedures with dispute: the number of employment contracts the organization intends to terminate due to a labor dispute or disagreement, to be measured in absolute numbers and as a percentage of the total number of terminated contracts.
  184. Number of vacancies: the number of open positions, to be measured in absolute numbers and as a percentage of the total workforce.
  185. Number of unfilled vacancies: the number of vacancies still open because no suitable candidates have yet responded.
  186. Number of applicants per vacancy: the number of applicants responding to a specific open position.
  187. Average number of applicants per vacancy: the total number of applicants divided by the total number of vacancies.
  188. Time-to-fill: the average time it takes to fill a vacancy, measured from when the vacancy is created to when the new employee starts.
  189. Average vacancy lead time: the average time in days that a vacancy is open, measured by dividing the lead times of all filled vacancies by the total number of filled vacancies.
  190. Recruitment costs: costs and time you invest in recruiting and selecting new employees, such as advertising costs, the fees paid to recruitment or staffing agencies, reviewing resumes, conducting interviews, and so on.
  191. Average recruitment costs: the total recruitment costs divided by the number of vacancies posted in a given period.
  192. Inflow: the number of new (permanent) employees hired by the organization in a given quarter, semester or year under a (temporary) employment contract.
  193. Outflow total: the total number of employees who left in a given period. Expressed as a percentage: divided by the total workforce.
  194. Percentage of employees leaving early: the outflow of new employees who have been employed for less than six months, to be measured in absolute numbers and as a percentage of the total number of leavers in a year.
  195. Layoff outflow: the outflow of employees due to an announced layoff, to be measured in absolute numbers and as a percentage of the total number of employees who left in a given period, for example, 1, 3 or 5 years.
  196. Absence rate: the percentage of employees absent on a given day divided by the total number of employees.
  197. Sick leave: the total number of days employees reported sick divided by 365 divided by the number of employees multiplied by 100.
  198. Short-term sick leave: the percentage of employees sick for less than a week.
  199. Medium-term absenteeism: the percentage of employees sick for more than a week but less than six weeks.
  200. Long-term sick leave: the percentage of employees unable to work for more than six weeks due to illness.
  201. Absenteeism rates: the ratio of short, medium and long-term absenteeism to be expressed in percentages, for example, 70%-20%-10%.
  202. Education and knowledge level: the number of employees in your organization who have completed an MBO, college or university education, to be broken down into a percentage by education type.
  203. Employee turnover: the average number of employees leaving your organization on an annual basis relative to the total workforce.
  204. Productivity per employee: the number of units produced per employee per hour, day or week.
  205. Span of control: the maximum number of employees a manager can effectively lead. Varies by person and industry. Generally, however, it is assumed that a manager can directly manage a maximum of 10 people.
  206. Salary development: the average wage increase per employee as a result of collective bargaining agreements or on the employer’s own initiative, to be measured as a percentage of gross monthly wages.
  207. Staff appraisal: the number of formal appeals following performance appraisals, in absolute numbers and as a percentage of the total number of performance appraisals conducted.
  208. Performance management: the number of employees who received performance bonuses, in absolute numbers and as a percentage of the total number of employees reviewed.
  209. Bonus percentage: the total amount paid in bonuses divided by the total salary sum, to be expressed as a percentage.
  210. Bonus percentage per employee: the average bonus percentage, to be measured as total amount paid out in bonuses divided by the total salary sum paid out the number of staff members who received bonuses.
  211. Training gap: the difference between current versus desired level of education, to be measured by number of education and training courses yet to be completed, number of (partial) certificates yet to be obtained, and so on.
  212. Training and education costs: the total amount spent on training and education relative to the total wage bill.
  213. Training budget per employee: the total amount set aside for training and education divided by the total workforce.
  214. Employee satisfaction: the extent to which employees are satisfied with their work, their work environment and their colleagues, to be measured by, among other things, the Employee Net Promoter Score: how likely are you to recommend your employer to acquaintances?
  215. Number of employee complaints: the number of complaints that come into the Human Resources Department from employees about colleagues and managers who engage in discrimination, sexual harassment, improper treatment, and so on.
  216. Strike days: the number of days per year that staff have ceased work in protest against poor salary policies and/or (allegedly) other unfavorable working conditions. This includes both official strikes and spontaneous work stoppages.
  217. Strike damage: the total amount of damage your organization suffers as a result of strike and spontaneous work stoppages of employees, to be expressed in total amount of lost sales, lost production, start-up costs, reputational damage and so on.
  218. Turnover per employee: the total turnover of the company divided by the total number of employees.
  219. Net sales: gross sales minus discounts granted, damages and taxes levied on sales.
  220. ARPU: the average revenue per user, or average revenue per subscriber, to be calculated by dividing the total revenue in a given period by the total number of subscribers or active users of a service.
  221. Number of postpaid subscribers: form of contract in telecom where the provider only bills after the service has been delivered. Postpaid customers tend to deliver higher ARPUs, higher margins and lower cancellation rates.
  222. Number of prepaid subscribers: a transactional model in which customers pay in advance and prior to using the telecom service. The customer puts a credit on a SIM card through the provider’s website or buys credit in stores. The prepaid business tends to have lower ARPUs and higher cancellation rates.
  223. Number of new subscribers: the number of new subscribers to a subscription or service, to be calculated per month and/or per year.
  224. Cost of sales: the costs associated with sales, such as the purchase of goods. The difference between revenue and cost of sales is gross margin.
  225. Profit: the difference between revenues and costs.
  226. Break-even point: the point at which your total revenues and total costs are equal and where you make neither profit nor loss, to be calculated by dividing fixed costs by gross profit margin.
  227. Cash flow or cash flow: the amount of income less the amount of expenses in a period.
  228. EBITDA: the profitability of a company measured before interest, taxes, depreciation and amortization.
  229. EPS: earnings per share, calculated by dividing a company’s net income, excluding dividends, by the number of shares outstanding. The higher the EPS ratio, the more profitable the company.
  230. Shareholder return (ROE): the company’s return on equity. You calculate ROE by dividing net income by equity. By comparing a company’s ROE to the industry average, you can say something about your company’s competitive advantage.
  231. P/E ratio per share: the share price of a company in relation to its earnings per share, to be calculated by dividing the market value per share by the earnings per share.
  232. Dividend: a company’s distribution of profits to its shareholders.
  233. Dividend yield: the dividend on a share expressed as a percentage of the share price, to be calculated by dividing the dividend per share by the market value per share and multiplying by 100%.
  234. Solvency: the financial resilience of your company expressed as the ratio of equity to debt.
  235. Interest coverage ratio: the company’s earnings before interest and taxes (EBIT) divided by the company’s interest payments over the same period.
  236. Payback period: the amount of time it takes an investment to pay for itself, calculated by dividing the initial capital cost for a project by the annual savings or income from a project. The shorter the payback period, the more attractive the investment is.
  237. Net Present Value (NPV): the difference between the present value of future positive cash flows (including any residual value) and an initial investment outlay. A positive NPV means that you can make investment prudently.
  238. Quick Ratio: the total of cash (cash), securities and receivables divided by current liabilities.
  239. Current Ratio: current assets divided by current liabilities. Current assets are your company’s assets, which you can convert into cash relatively easily (usually within a year). Current liabilities are short-term debt with a maximum repayment period of one year.
  240. Working capital: the difference between current assets and current liabilities. Working capital is the capital your company needs to meet its daily financial obligations.
  241. Accounts payable turnover rate: a ratio indicating the average number of days it takes your company to pay its suppliers, calculated by dividing the accounts payable item by the cost of sales and multiplying the result by 365 days.
  242. Accounts receivable turnover rate: a ratio indicating the average number of days it takes a customer on account to pay his bill, to be calculated by dividing the item accounts receivable by the cost of sales and multiplying the result by 365 days.
  243. Payment morale: degree to which the customer keeps payment agreements. Good payment morale exists if customers pay bills on time, i.e. within the agreed payment period.
  244. Number of doubtful debtors: the number of customers (defaulters) who will probably never pay their invoice.
  245. Bad debt provision: a percentage of the realized turnover, including VAT, that you reserve in connection with writing off receivables from bad customers who will probably never pay.
  246. Number of payment arrangements: the number of binding agreements you make with customers about paying outstanding bills in installments. Among other things, you agree with the customer on which date he will pay which installments.
  247. Percentage of reminders or demands: the number of reminders and demands sent divided by the total number of invoices sent.
  248. Percentage of collection actions: the number of customers who do not pay on time according to the payment terms and have to be reminded and/or reminded, expressed as a percentage of the total number of customers.
  249. Percentage of uncollectible receivables: the number of receivables from customers that will definitely not be collected again, for example due to bankruptcy of the customer, to be expressed as a percentage of the total number of outstanding receivables in a period.
  250. Number of shipments per day: the total number of containers, pallets, packages, boxes and so on that left the distribution center, warehouse or port per day, to be measured in numbers, kilograms, tons and so on.
  251. Number of return shipments per day: the number of shipments that did not reach the customer because of overflow due to traffic jams, a wrong address or refused receipt, to be measured in absolute numbers and as a percentage the total number of return shipments.
  252. Number of repeat shipments: the number of shipments already offered to the same customer before, to be measured in absolute numbers and as a percentage the total number of shipments.
  253. Percentage of shipments damaged: the number of shipments damaged in transit and returned to sender relative to the total number of shipments.
  254. Shipping frequency: the average number of shipments per customer per day, also known as the number of stops. Supermarkets and/or distribution centers are sometimes delivered several times a day.
  255. Percentage of shipments “first time right”: the number of shipments that were delivered correctly and on time in one go relative to the total number of shipments.
  256. Percentage of shipments with deficiencies: the number of shipments that were not fully delivered according to customer agreements relative to the total number of shipments.
  257. Internal order processing time: the time it takes to complete an order from the time the order enters the warehouse to the time the order leaves the distribution center or shipping zone.
  258. Fuel consumption: the fuel consumption per 100 kilometers, where the on-board computer provides feedback on driving behavior such as speed, RPM, acceleration, deceleration, idling et cetera. To be broken down for the entire fleet, per vehicle type, per vehicle and/or per driver.
  259. Transportation costs: the total transportation or transport costs you have to spend to transport orders from the place of production to the place of use.
  260. Transportation costs to sales: the ratio of transportation costs to sales realized.
  261. Transportation efficiency: the average distance in miles from the distribution center per drop relative to the most efficient, optimal route, to be calculated by an algorithm.
  262. Vehicle load factor: the weight transported divided by the maximum permissible weight transported by truck, boat or train, to be expressed as a percentage.
  263. Unused capacity: the number of miles traveled by empty trucks in a given period relative to the total miles traveled.
  264. Fleet availability: the percentage of the fleet or truck convoy that you cannot deploy operationally, such as due to regular or unscheduled maintenance.
  265. Cargo loss: number of products (number, tonnage) not arriving at destination or no longer usable after transportation due to theft, spoilage and so on, to be measured relative to the total amount of products loaded.
  266. CO2 emissions: the amount of nitrogen dioxide emitted per kilometer traveled by a truck, train or boat.
  267. Sustainable transportation: the number of electric trucks or trucks running on biofuel or hydrogen divided by the total fleet running or running on conventional fuels.
  268. Logistic delay: number of trips left late ranked by cause, e.g. driver, captain or mate is sick, or fuel was not refilled on time, relative to the total number of trips performed.
  269. Average departure delay: the cumulative time difference per trip between departure and scheduled departure times in days, hours or minutes relative to the total number of trips performed.
  270. Average arrival delay: the cumulative time difference per trip between arrival time and scheduled arrival time in days, hours or minutes relative to the total number of trips performed.
  271. Number of servers: the number of physical and virtual servers that the IT department and/or a cloud provider manages on premise (on its own premises) and in the cloud for the organization at a given time.
  272. Server management: the total number of servers divided by the number of system administrators.
  273. Number of bugs: the number of errors in the source code of a computer program that can lead to serious disruptions and/or interruptions in computer systems and service delivery.
  274. Response speed: speed in hours, minutes at which bugs and outages are fixed.
  275. Number of open tickets: the number of user questions, requests and reports not yet followed up by ICT. Expressed as a percentage of the total number of tickets. A ticket system stores all incoming questions from multiple communication channels in one location.
  276. Effectiveness of ICT staff: the number of unresolved tickets, broken down by ICT staff.
  277. Productivity ICT staff: the average number of resolved tickets per ICT employee in a given period, to be measured by dividing the total number of resolved tickets by the number of ICT employees who resolve tickets.
  278. ICT project success ratio: the number of successful ICT projects divided by the total number of ICT projects started.
  279. Number of SLAs achieved: the number of service level agreement indicators that the organization has achieved in a period, to be expressed in total number of SLAs concluded. In an SLA, you lay out, among other things, promised response and/or delivery times, rates and how the service is measured.
  280. Application landscape complexity: the complexity and diversity of the application landscape, to be measured by the number of different systems and/or applications the organization has installed.
  281. Supplier dependence: excessive dependence on one small or large supplier, to be measured by the percentage of total ICT costs claimed by that supplier in a given period.
  282. ICT costs: the total costs of hardware, infrastructure, depreciation, software, cloud services, set-up costs, personnel and management and so on, to be expressed as a percentage of the total ICT budget.
  283. ICT costs per employee: the total ICT costs divided by the total number of staff.
  284. ICT costs as a percentage of turnover: the total ICT costs expressed as a percentage of total turnover.
  285. Backup Success Rate: the percentage of backups you can restore and test without problems.
  286. First Call Resolution Rate: the percentage of incidents or complaints that are resolved immediately upon first contact. See also First Time Right.
  287. Average Repair Time: the average time it takes the IT department to fix an incident or problem.
  288. Incident Response Time: the time elapsed between the time of an incident report and the first response from the ICT department.
  289. Mean Time Between Failures (MTBF): the average time between failures or system downtime (MTBF).
  290. Mean Time to Detect (MTTD): the average time it takes to detect a problem or cause (MTTD).
  291. Mean Time to Failure (MTTF): the average time between a hardware failure or breakdown (MTTF).
  292. Mean Time to Restore Service (MTRS): the average time it takes to resume normal service after a failure.
  293. Latency: a delay in data transmission over a communications network. Latency, measurable in (milli)seconds, is the time it takes the network to respond when data is requested. Latency can occur at the client, the server and/or the network. A practical tool for measuring latency is “ping.”
  294. Security Incident Response Time: the response time between the time of a security incident and the department’s first response.
  295. Service Request Completion Rate: the percentage of service requests completed within the agreed upon time by your organization.
  296. Uptime: the time your Web site or Web service is available to users in a given period of time, or in other words, the available time divided by the total time. While 100% uptime is always the goal, 99.999% uptime is perceived as high availability.
  297. Website downtime: the time in hours or minutes that your website is unavailable to the public. Most vendors guarantee at least 99.9 percent uptime, or 0.01 percent downtime. This means that your Web site will be unavailable for a maximum of 1 minute and 26 seconds per 24 hours converted.
  298. Downtime telecom: the time in hours or minutes per month or per year that the mobile network (4G/5G) is unavailable due to outages from a customer perspective.
  299. Attendance/presence rate: the number of tardy and truant students in education relative to the total student population, to be measured by semester and/or year.
  300. Education housing ratio: housing expenses plus depreciation of buildings and grounds, divided by total expenses.
  301. Teacher attrition rate: teacher attrition rate expressed as the number of days absent, on leave and sick days relative to the total number of school days.
  302. Dropout rate: the extent to which students do not complete their schooling, expressed as number of dropouts relative to the total number of students.
  303. Success rate: the number of graduates relative to the number of final examination candidates per program and/or discipline.
  304. Study delay: the average number of months of study delay expressed as a percentage of the nominal duration of a particular (school) program.
  305. Livability: the degree to which citizens in a municipality feel comfortable in their living environment to be expressed in terms of, among other things: the percentage of playing space and in the city in square meters, green areas, parking facilities, the number of sports facilities, and so on.
  306. Charging station density: the number of installed charging stations per 10,000 residents of a municipality.
  307. Green space: the number of square meters of forest and open natural terrain, such as parks and parklands, per inhabitant of a municipality.
  308. Accessibility: the flow of traffic in a given municipality expressed in terms of minutes of delay per movement (car), to be measured by sensors in the road surface and cameras that measure flow.
  309. Road safety: the number of accidents with injuries in a given municipality, broken down into absolute numbers of traffic fatalities, serious traffic injuries and the number of minor and other injuries.
  310. Housing: the number of house seekers on the waiting list for social housing in a given municipality.
  311. Percentage of skewed tenants: the number of tenants within a housing association who rent social housing whose rent is too low in relation to his or her income.
  312. Site occupancy rate: number of days worked relative to the number of workable days, in this case the number of available days minus frost, and rain leave days.
  313. Delivery: the percentage of undelivered goods by an online store because the customer or neighbors were not home at the time of delivery.
  314. Cost/income ratio: the ratio of costs to revenue at a banking institution.
  315. Claims behavior: the number of claims at a non-life insurer, expressed as a percentage of number of insureds.
  316. Fraud: the number of registered fraud reports at a bank or insurer expressed as a percentage of the total number of transactions. Fraud occurs, for example, as a result of money laundering, the use of a stolen credit card or the submission of false insurance claims.
  317. Illegal power taps: the percentage of illegal power taps relative to total customer base at an energy company.
  318. Declarability, productivity: the number of billable hours divided by the total number of available hours a person can work in business services multiplied by 100.
  319. Percentage default: the number of customers or entrepreneurs of a bank relative to the total bank customers who are no longer able to repay a bank loan. This is what the bank must write off.
  320. Claims processing time: the average processing time at a claims insurer, or the handling of claims (from notification to payment), expressed in hours or days.
  321. Benchwarmers: the number of candidates registered with a staffing or placement agency who are unemployed relative to the total number of candidates registered or placed.
  322. Empty hours: the percentage of non-productive hours of IT consultants relative to total workable hours.
  323. Fill ratio: the number of placements by an employment agency relative to the number of applications.
  324. Time-to-fill ratio: the average time in days between the creation of the job offer and acceptance of the offer by the candidate from the staffing agency.
  325. Time-to-start ratio: the average time in days between acceptance of the offer and the temporary worker’s first working day with the client.
  326. Reassignment ratio: the percentage of temporary workers who are reassigned to an existing or new client after a temporary job.
  327. Obsolete lease cars: the number of lease cars returned to the car leasing company which cannot be redeployed or sold to individuals, to be expressed as lost rental turnover per month, week or day.
  328. Average lease car delivery time: the difference between the actual delivery time and the agreed delivery time of a lease car, expressed in days.
  329. Obsolete stock: the percentage of goods in retail or in a webshop that are unsaleable. It refers to the number of units of goods you have to discard or destroy compared to the total number of units purchased.
  330. Buying flow: number of visitors in your store compared to the number of visitors in the shopping street, to be measured among other things based on (manual counts) and/or enabled location-based services on visitors’ cell phones.
  331. Claimability specialists: the percentage of billable hours of hospital specialists rejected by the insurer compared to the total billable hours submitted.
  332. Waiting list: the total number of days that mental health clients and patients are on the waiting list (+ average) to receive treatment.
  333. Mispricing: the number of items in a webshop or store that are mispriced (too low/too high) relative to the total number of items priced, to be expressed in monetary terms.
  334. Out-of-stock percentage: the number of orders or products that are undeliverable, or in other words, the number of units of goods that a customer bought/ordered in a store or webshop, but could not be delivered (on time) relative to the total number of units sold/ordered.
  335. Facility cost per square foot: the gross facility cost per square foot of office space managed.
  336. Maintenance cost per square foot: the total maintenance cost divided by the square footage of office space managed by the facility manager. The number gives an indication of the maintenance budget required.
  337. Cleaning cost per square foot: the total cleaning cost divided by the total square footage of office area to be cleaned.
  338. Compliance cleaning schedule: the number of cleaning jobs where the client’s production process is disrupted and/or cleaning takes place at undesirable times, to be expressed in total number of cleaning jobs.
  339. Cleanliness cleaning objects: beauty of objects/surfaces, to be measured based on regular or ad hoc camera detection of space and/or analysis of images.
  340. Housing repair policy: the speed with which repair requests are handled by a property operator or housing corporation, expressed as the average number of days it takes for a repair request to be handled to the satisfaction of the tenant.
  341. Table changeover time: the total clearing and cleaning time in a restaurant of a used table for new restaurant visitors, expressed in minutes relative to the total number of cleanings.
  342. Food safety: the number of observed deviations from the HACCP lists in the hospitality industry, determined per item by the Dutch Food and Consumer Product Safety Authority (NVWA).
  343. Food waste: the number of (partial) dishes returned by customers in the hospitality industry out of the total number of (partial) dishes served and the number of products (ingredients) past their sell-by date/total number of products.
  344. Percentage of recycling waste: the percentage of municipal waste that is recycled, to be measured as the number of tons of recycled waste divided by the total number of tons of municipal waste (excluding commercial waste).
  345. Material loss waste: the percentage of municipal waste that is not reused, but submitted to the waste incinerator, composted or landfilled.
  346. Air quality: the number of days per year when the daily average of particulate matter (PM10) in a province or municipality exceeds a set standard, for example >50 μg per cubic meter. µg is the symbol indicating the metric microgram that is one millionth of a gram.
  347. Percentage of medication waste: the number of hundreds of thousands of kilograms of medication discarded per year that ends up in the environment through waste disposal and/or sewage systems relative to the total number of medications dispensed in hundreds of thousands of kilograms.
  348. Energy efficiency: the ratio of the performance, service, goods or energy obtained to the input of energy used to do so. The less input required in relation to output, the more efficient a process is. The closer the ratio is to 1, the more efficient the process.
  349. Power Usage Effectiveness (PUE) data center: the total energy requirement of the data center divided by the energy required to run all servers, storage devices and switches. The closer the result approaches 1, the more energy efficient the data center is.
  350. Data Center Idle Coefficient (DIC): the energy consumed in a data center in an “idle” state divided by the total energy consumed by the IT hardware. In “idle state,” the CPU is active for such things as the operating system and the like, but is not performing any external work.

How do you set up a KPI?

Setting up KPIsWhether you are a start-up entrepreneur or an experienced manager, setting up KPIs is not a routine task that you do in a hurry. It’s more like a big puzzle for adults that you have to put together piece by piece. In short, you have to sit down and think about it. This is not only because of the difficult words KPI experts sometimes use. But thinking in cause-effect relationships is also difficult for some people. “You see it when you understand it.”, as Johan Cruijff would say. At Passionned Group, we say: download the SMART KPI toolkit 2024 because with it you’ll give yourself a kick-start.

Start with the mission

Every organization enters the market with a certain mission. With a mission you indicate what contribution your organization wants to make to society. For example, a supermarket chain considers it’s important to “work together to make better food available to everyone.” A teaching hospital considers “a healthy population and excellent care through research and education” its most important mission. A funeral home’s mission is “for everyone to say goodbye with a good feeling.”

Monitor strategic progress with KPIs

But a mission without strategic goals is too non-committal. You will want to monitor the progress of your strategic goals and measure them in the interim using KPIs.

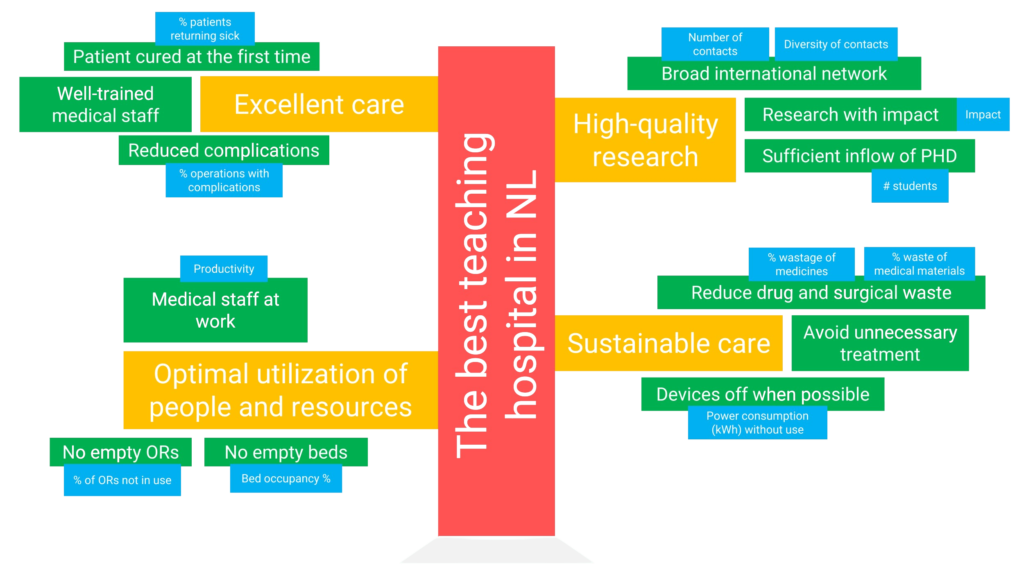
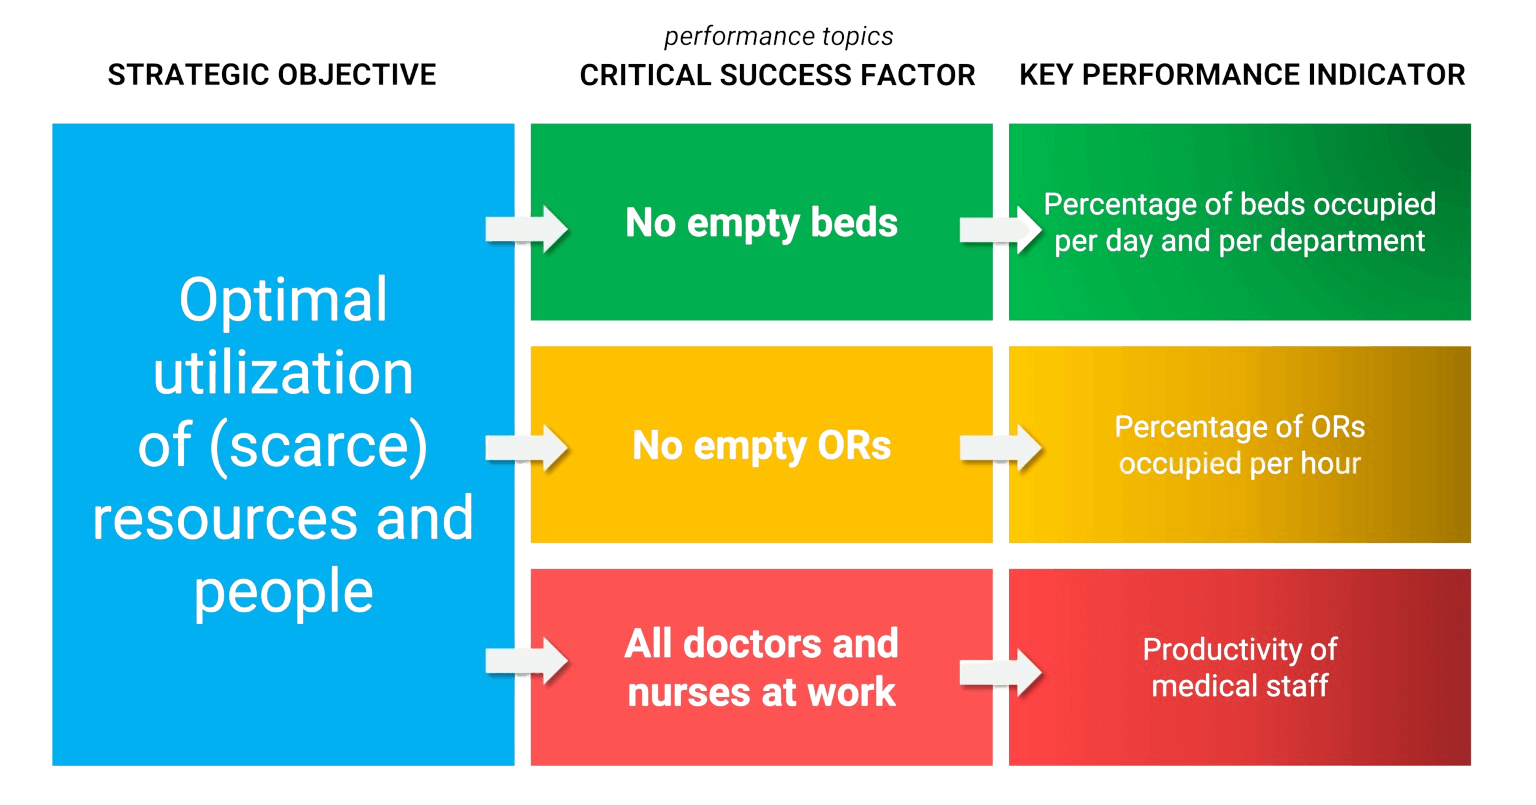
KPI hospital exampleFigure 3: KPI example of a hospital. The extra step between a strategic objective and Key Performance Indicators.

Because there is often a great distance between what is conceived in the boardroom and the KPIs on the shop floor, an intermediate step has been devised: the critical success factor (CSF).

These are the areas in which you excel as an organization and which set you apart from the competition. Like, for example, an extremely friendly customer service department that goes out of its way to put a smile on the customer’s face. Or take Apple’s loyal fans who guarantee a continuous stream of repeat purchases. The relationship between mission, strategic objectives, critical success factors and KPIs is depicted in Figure 3.

Download the SMART KPI Toolkit

Elaborated example KPI setting

A small, traditional Dutch publisher of spiritual books is facing increasing competition. The publisher mainly targets young managers who are looking for meaning in their work and private lives. They want to become the largest in that segment and grow in market share.

There are many new entrants to the market. Small publishers are popping up like mushrooms and competing on price. Authors are increasingly self-publishing books, no longer in print but in electronic form. The Dutch language and sales area is limited. At the same time, people are reading less. Managers with young children have less and less time to read. Nevertheless, publishers still believe in richly illustrated books published on paper.

Its mission is to provide managers with an inspiring and memorable reading experience at the right time. This means publishing books that run well and are well appreciated. Selecting top authors and manuscripts with enormous potential is the critical success factor here. The publisher and editors meticulously review those promising manuscripts, and if they receive a positive recommendation, they then publish them. The KPIs involved are:

  • The percentage of reviewed manuscripts that lead to publication.
  • The percentage of successful editions, that is, more than 1,000 copies sold in the first year and at least an average reader review score of 4 stars (maximum is 5).

Until recently, the management steered mainly by circulation figures and financial indicators such as a 20% return norm for books. Now they want to focus on these KPIs. By focusing heavily on this, it should also (automatically) lead to a higher market share.

Delve into the 5 biggest KPI blunders here

Setting up KPIs in 6 steps

For ease of understanding, below we will walk through the steps the spiritual book publisher must take to apply the KPIs. The six steps are universally applicable: that is, they apply to anyone who is going to establish KPIs.

  • 6 steps to set KPIsStep 1 is to identify the KPIs in line with the mission and strategic objectives. See the previous section.
  • Step 2 is to establish the definition of KPIs. The publisher defines the first KPI by dividing the number of publications in a given period by the number of reviewed manuscripts and multiplying by 100, thus calculating the success ratio. The publisher defines the second KPI by the number of copies sold in the first year after publication and the reviews received.
  • Step 3 is to load the KPIs with the right data so that the numbers can be produced and displayed on a dashboard. To do this, the publisher combines data from the manuscripts database, data from the ERP system and external data (reviews).
  • Step 4 is to visualize the KPIs on a dashboard with a BI tool. A KPI tile with associated line graph is chosen that can display the score per week and month.
  • Step 5 is to standardize KPIs. Initially, management and the publisher want at least 20% of reviewed manuscripts to reach publication. And they standardize the success rate at 25%.
  • Step 6 is to operationalize the KPIs. In a series of working sessions with the various teams, they look at what is needed to achieve the standards. In addition, they discuss how a continuous improvement process can be designed.

In particular, steps 4 through 6 prove crucial to the success of KPIs.

5 tips for finding KPIs

Are you also eager to start the search for the right KPIs? Below are 5 tips for finding key performance indicators in your organization:

  1. Think in disaster scenarios: can’t immediately identify the key performance indicators in your organization? Then think about the biggest disaster that could befall your organization, division or department. Does such a disaster seem unlikely to you? Then consider what the second biggest disaster is. And so on.
  2. Look at time: processes often go wrong when things are not completed on time and/or not delivered on time (see the elaborated example above). Many Key Performance Indicators have to do with time, such as lead time.
  3. Ignore financial indicators: although Key Performance Indicators always have a financial impact, they themselves are never financial. That is, there is no euro sign in front of them. So, in your search for true Key Performance Indicators, quietly leave out all financial indicators.
  4. Focus on satisfied customers: finding the right Key Performance Indicators is easier by looking at what drives high customer satisfaction. What really makes your customers very happy?
  5. Be critical of infrastructure: do your processes lean heavily on certain infrastructure or is that infrastructure the core of your business? Hiccups in infrastructure often prove to be particularly critical to keeping your results up.

More tips? Our complete KPI guide 2024 contains more than 350 detailed examples and a sophisticated method to quickly determine the right key performance indicators for your own organization.

SMART KPI Toolkit

Draw a KPI tree

A useful tool for solving the KPI puzzle is to draw a so-called KPI tree. A KPI tree shows the cause-effect relationships between mission, critical success factors and KPIs. The tree forms a very compact and understandable summary of your business strategy. At the same time, you can see how the various KPIs are distributed across the various departments and functions. Thanks to this overview, everyone in the chain knows what is really important and where improvements can be made (see Figure 4).

KPI treeFigure 4: An example of a KPI tree from healthcare. A KPI tree helps you make the essence of your organization and associated governance clear immediately. You translate the mission (red) into strategic goals (yellow), and you translate those into Critical Success Factors (green) and KPIs (blue).
Moreover, the KPI tree allows you to better justify your investments. For example, if a teaching hospital is aiming for high-quality research, it will not only have to attract enough students who want to do a PhD, but it may also have to apply for subsidies in time to purchase that one super-sensitive MRI scanner that costs millions of dollars. Next, the operations manager, together with his or her staff, will have to figure out which KPIs now contribute to the optimal use of scarce people, resources and (expensive) equipment. Value-based Health Care (VBHC) is an important trend in this regard.

3 tips for setting up a KPI tree

So how do you practically set up a KPI tree?

  1. Setting a KPI treeTake your organization’s mission and strategic goals as a starting point, such as increasing profitability, increasing market share or improving employee satisfaction.
  2. Then think about and describe what is important to achieve those strategic goals.
  3. Make the processes measurable with Key Performance Indicators (for example, the average waiting time in the call center or the number of unoccupied ICU beds in a hospital) and specify them for multiple departments and functions within your organization.

With a KPI tree, you immediately make the connection between the strategic and operational goals and thus structure the most important Key Performance Indicators for your company. There is also another interesting approach that establishes a relationship between KPIs and the process of value management.

Hire a KPI specialist

Draw up a KPI definition table

In addition to drawing a KPI tree, there is another useful tool that you can use perfectly well when drawing up KPIs: a so-called KPI definition table (see Figure 5). In such a table you include the data sources, the measurement unit, the formula, the standards and the frequency of KPI measurements. In doing so, do not forget to also appoint a KPI owner within the organization.

KPI definition tableFigure 5: An example of a hospital KPI definition table (not complete).

The 4 different types of KPIs

As mentioned earlier, an indicator is a source of information that represents a situation or condition over time. Nothing more and nothing less. But when managers or employees talk about KPIs, confusion sometimes arises. That’s because there are different types of indicators.

For example, you can distinguish financial and non-financial indicators, hard and soft indicators, as well as quantitative and qualitative indicators. There are both output and input indicators. There are indicators that mainly look back and there are indicators that look forward and try to make predictions, such as the well-known weather indicators.

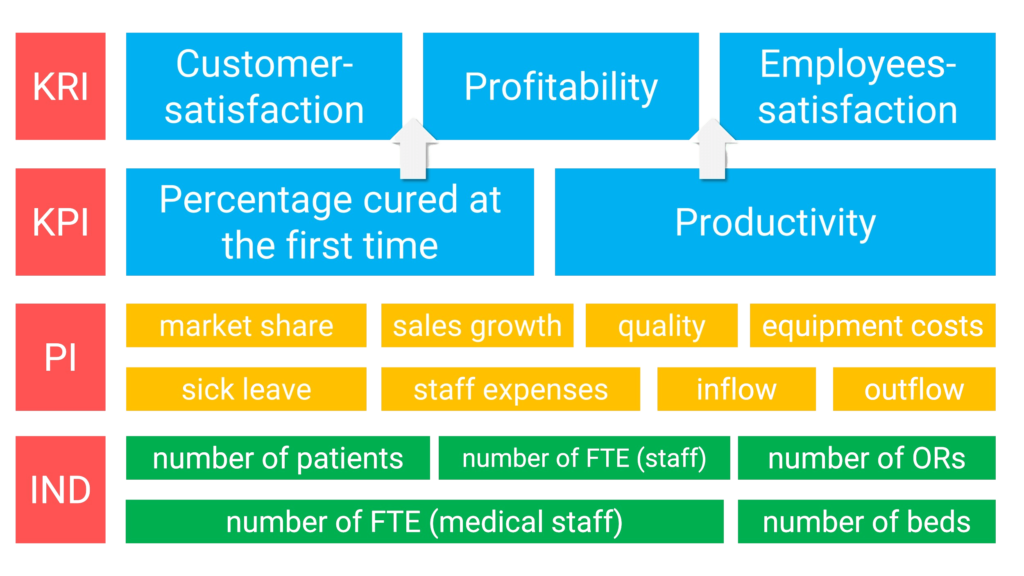
In order to keep the discussion as pure as possible, Passionned Group distinguishes four different types of indicators: the KRI, KPI, PI and the “regular,” straightforward indicator, abbreviated as IND. Below we explain these abbreviations (see also Figure 6).

Different types of KPIFigure 6: There are four different types of KPIs: the KRI, the unadulterated KPI, a PI and a normal indicator. Here we explain these abbreviations.

  • Key Result Indicators (KRIs): these are indicators that show scores in a broad result area that are the result of multiple actions or measures. For example, a company’s profitability is influenced by multiple factors. The same goes for customer satisfaction, employee satisfaction and quality delivered.
  • Performance Indicators (PIs): these indicators show the organization what it needs to do in one very specific result area. They are not very critical to the efficient execution of business processes. For example, think of a PI as the average duration of a customer relationship or the average sales discount.
  • Indicators (IND): these are measurement points that show the result of a single action. They can be part of KRIs, PIs or KPIs. They are critical to achieving a better overall result, for example, the number of calls handled in a call center, the number of new customers or the number of quality inspections performed.
  • Key Performance Indicators (KPIs): these are indicators that reflect the scores resulting from one action or event that directly positively or negatively affects all key result areas. Consider a delayed flight, a delayed operation or the failure of a payment app, such as Paypal.

An indicator that does not belong in the above list but is often mentioned in the same breath is the Critical Success Factor (CSF). It is a qualitative objective to which you cannot assign numbers. It is a verb. But the CSF does determine whether and for how long you will be successful with your business.

To be able to determine what kind of indicator you are dealing with, Passionned Group has put together a handy decision chart that you can consult in the SMART KPI toolkit 2024.

If you want to know more about the right mix and applicability of the different types of indicators in your organization and are looking for more KPI explanations and KPI examples, please contact one of our interim consultants or choose the services of our KPI Expertise Center.

Improve your KPI performance with a data-driven PDCA cycle

In the publisher’s KPI example detailed above, the success rate of reviewed manuscripts needed to get to 20%, say, in just under three years. That’s easier said than done. But how do you box that in? You do it step by step by continuously improving the process of reviewing manuscripts. Passionned Group has developed a unique tool for this purpose: the data-driven PDCA. The data-driven PDCA leans on five important basic principles (see Figure 7).

Data driven PDCAFigure 7: The five basic principles of the data-driven PDCA cycle

Within the data-driven PDCA, data is the main foundation for making decisions. Another important principle of the data-driven PDCA is that it is no longer management that decides how to improve performance. It is the self-managing, autonomous teams that step by step, based on the data, insights and dashboard, implement the required improvement actions, assess the effect and implement new improvement actions.

Make smarter choices

Four phases

In essence, there are four phases you can distinguish when going through the data-driven PDCA cycle:

Data Science Book

  1. In the first phase, you are going to formulate plans and objectives SMART with KPIs and standards. You do this carefully and with each other. Because before you know it, a standard turns into an unachievable or unattainable goal.
  2. Then, in phase two, implementation takes place. You collect all relevant data, present it in a report or on a dashboard and analyze it.
  3. In the third phase, you discuss whether you and your team are on the right track: you compare the results with the KPI norm and the plan. You give each other feedback and tips.
  4. In the final, fourth phase, you adjust the norms and KPIs. The idea is to raise the bar a little higher each time. This is the only way to create a culture in which colleagues think about how to improve their own performance.

Want to know more about the data-driven PDCA cycle? Then take a look at the PDCA cycle page.

Contact us

Have you gained enough inspiration based on the given KPI examples and explanations and do you now want to get started with Key Performance Indicators yourself? Would you like to philosophize with one of our KPI experts or do you just want a second opinion? Don’t hesitate, share your thoughts and experiences and contact us here.

About Passionned Group

Logo Passionned Group, the expert in KPIsPassionned Group is the specialist in KPI setup and everything that comes with it. Our experienced KPI experts help SME+ organizations in the transition to an intelligent, data-driven organization. Every other year we organize the Dutch BI & Data Science Award™.

Contact us

Frequently Asked Questions

Why are KPIs important?
Every professional organization works with strategic and operational goals. KPIs allow you to measure the extent to which those goals are achievable. If the goals are too ambitious, then you can slow down. If they are too weak, then you can step it up a notch.
Can a KPI be formulated in financial terms?
No, a true KPI is never financial in nature. That's because KPIs drive future financial results.
How do you know if you really have a KPI to address?
Go through the diagram in the SMART KPI Toolkit 2024 and answer yes or no to the questions. That way you'll automatically stumble upon one of the four different indicators, including the KPI.
What is the difference between a KPI and a KRI?
A Key Result Indicator shows the score in a broad result area, for example, a company's profitability, customer satisfaction, quality delivered or employee satisfaction. A Key Performance Indicator, on the other hand, has a direct impact on multiple result areas and is also measurable on a daily basis.
Is the Net Promoter Score a KPI?
The Net Promoter Score is not a Key Performance Indicator, but a Key Result Indicator. It is not wrong to measure customer satisfaction via the NPS (or the Customer Effort Score), but the score on this is a sum of many factors and not the result of one action as with a KPI.
What are performance indicators?
Performance indicators show the score in one very specific result area. They are not very critical to achieving excellent business results. Consider, for example, percentage sales growth in a particular region.
What can you measure with a KPI?
With a KPI you measure how you can directly influence the most important broad result areas of an organization on a daily basis.
What properties must a KPI satisfy?
A KPI but especially its associated target value (the norm) must always be formulated according to the SMART principle. Each norm on a KPI must be specific, measurable, acceptable, realistic and time-bound.
How many KPIs do I need to properly manage my organization?
The ideal number of KPIs depends on the size and complexity of the organization and the number of strategic goals you formulate. An experienced manager of a medium-sized company should come a long way with three to a maximum of five KPIs per strategic objective.

Our KPI specialists

Photo Daan van Beek - Senior KPI Consultant and AuthorDAAN VAN BEEK MScSenior KPI Consultant and Author
Photo Leo Kerklaan - Senior Consultant Performance Managementmr. LEO KERKLAANSenior Consultant Performance Management
Photo Wouter Huisman - Senior KPI Consultantdrs. WOUTER HUISMANSenior KPI Consultant

A selection of our customers

Become a customer now

Do you also want to become a customer of ours? We are happy to help you with SMART KPI's, Performance Management or other things that will make you smarter.

Photo Daan van Beek - Senior KPI Consultant and AuthorDAAN VAN BEEK MScSenior KPI Consultant and Author

Contact me directly

Fact sheet

___
customers
___
training courses
___
people trained
9.3
customer satisfaction
___
consultants & teachers
20
years of experience